How to Measure Trade Show ROI: 6 Steps and a Template

The formula is simple: ROI % = (net return ÷ total cost) × 100. Getting the numbers right is where most companies go wrong.
Most trade show post-mortems fail because teams try to measure ROI after the event, working backwards from a spreadsheet. The decisions that determine your ROI — agreed goals, lead definitions and source tagging — have to be made before you book the stand space. Get those right first, and the measurement is mostly data collection.
This guide walks through six steps, with a worked example and a template you can copy.
The formula — and why it alone misleads
ROI % = (net return ÷ total cost) × 100. Net return is revenue attributable to the show, minus everything you spent.
A £20,000 stand that generates £30,000 in closed revenue gives you 50% ROI. The problem: that number is only as good as the revenue you can attribute. A deal closed eight months after a show conversation is still show revenue, but it rarely makes it onto the debrief slide because no one tagged the source in the CRM.
The formula also says nothing about brand visibility, client relationships renewed, or product feedback gathered on the floor. Those matter too — and step 5 covers how to record them alongside the hard number.
Step 1: Set goals before you spend
The most common reason trade show ROI can’t be measured is that no one agreed what success looked like before the stand was built.
Set three to five measurable goals before you commit to the space. Here is a format that works:
| Goal | Metric | Target | How you will track it |
|---|---|---|---|
| Generate new qualified leads | Opted-in scans or cards | 50 | CRM, labelled trade-show-2026-X |
| Reinforce existing relationships | Meetings held | 10 | Sales team’s calendar log |
| Increase brand visibility | Stand footfall | 500 | Clicker count or badge scanner |
| Test interest in new product | Demo requests | 20 | Stand sign-up form |
| Recruitment | Expressions of interest | 15 | HR inbox or stand form |
Notice the targets are pre-agreed, not reverse-engineered. “We got 43 leads — was that good?” is harder to answer than “We set a target of 50 and hit 86%.” The benchmark is your own plan, not a competitor’s blog post.
Step 2: Add up the true cost
Most trade show budgets undercount because they capture stand build and space but miss the rest. Every line below belongs in your denominator.
| Cost line | Notes |
|---|---|
| Stand space (floor area) | Usually charged per m² |
| Stand design and build | Amortise over planned reuses if the structure is reusable |
| Stand activation | Your quote from supplier |
| AV and tech hire | Screens, microphones, power distribution |
| Logistics | Transport, storage, insurance |
| Staff travel, accommodation and subsistence | Two days for a team of five adds up quickly |
| Staff time (internal) | Apply a day rate for an honest picture |
| Pre-show marketing | Email, social, paid ads driving footfall to your stand |
| Lead capture technology | Badge scanner hire or app subscription |
| Post-show follow-up time | Typically 1–2 days per rep; almost always left out |
| Total |
Staff time and post-show follow-up are the hidden cost lines that inflate your apparent ROI if you leave them out. A 20-person-day investment at a modest day rate can easily add £6,000 or more that never appears in the budget document.
Step 3: Capture and tag leads properly
A crowd at your stand is not a lead. “Loads of people stopped” is an engagement measure. It becomes a lead when someone gives consent and you record their details with intent to follow up.
Qualify leads on the spot. An A/B/C system works well: A = decision-maker, right company size, expressed purchase intent; B = relevant but not ready; C = unknown or unlikely fit. Your post-show follow-up cadence should differ by grade — A contacts within 24 hours, B within the week.
Tag the source in your CRM. Every contact captured at the show needs a source field set to the event name and year (trade-show-2026-manchester, for example). Without it, you will never be able to pull the revenue figure at the 12-month checkpoint.
Follow consent rules. UK GDPR and PECR require you to tell contacts what you will use their details for at the point of capture. Check the ICO’s direct marketing guidance for what constitutes valid consent for follow-up emails before the show, not after.
QR codes and UTM parameters on your stand capture digital traffic too — useful if you are driving visitors to a demo booking page or a tailored landing page for the show.
Step 4: Track leads to revenue
The conversion from stand conversation to signed contract takes weeks or months in most B2B markets. Set three review checkpoints — 3, 6 and 12 months after the show — before you leave the venue.
At each checkpoint, pull from your CRM:
- Leads captured: total, by A/B/C grade
- Pipeline generated: total opportunity value from show-sourced leads
- Revenue closed: deals won where source field = show
- Deals still open: value and stage
Your ROI calculation uses only closed revenue. But tracking open pipeline gives you a forward projection to share with budget holders while deals are still progressing.
For interim reporting, this formula helps:
Projected ROI = ((closed revenue + (open pipeline × your average close rate) − total cost) ÷ total cost) × 100
Label it clearly as projected, not actual. It signals confidence without overstating results.
Step 5: Count what the formula misses
Some of the most valuable outcomes from a trade show do not appear in the revenue column for 18 months — or ever. Keep a separate record alongside the formula.
- Meetings with existing clients. Retention conversations that prevent churn have a value; it is just harder to quantify. Log who you spoke to and what was discussed.
- Media and press contacts. If journalists, industry bloggers or social accounts covered your stand, record impressions and any resulting coverage.
- Content assets created. Photos, video, testimonials and social content captured on the stand floor have ongoing marketing value beyond the event.
- Competitor and market intelligence. What did you learn walking the floor? What did prospects tell you about their current suppliers or pain points?
- Partnership conversations. Introductions that are not leads yet but could become useful over time.
Present these alongside the ROI figure in your debrief. A stand that delivered 20% direct ROI plus a suite of content assets, three warm partnership introductions and five client retention conversations looks very different from one that delivered 20% and nothing else.
Step 6: Measure whether the stand drew people in
Footfall, conversations and opted-in scans are three different things — and only one of them is a lead.
| Measure | What it tells you | How to capture it |
|---|---|---|
| Footfall | Raw awareness reach | Manual clicker, badge scanner log, traffic counter |
| Dwell time | Whether the activation engaged visitors | Timed observation or camera analytics |
| Conversations | Active interest | Staff tally sheet |
| Opted-in scans | Lead intent | Badge scanner or sign-up form |
| Demo requests | High-intent signal | Booking form or app |
The ratio between footfall and opted-in scans is your engagement conversion rate — a useful indicator of whether the stand concept worked. Six hundred people stopping and twelve scanning suggests the stand drew attention but did not convert it. That is a stand design or activation problem, not a list quality problem.

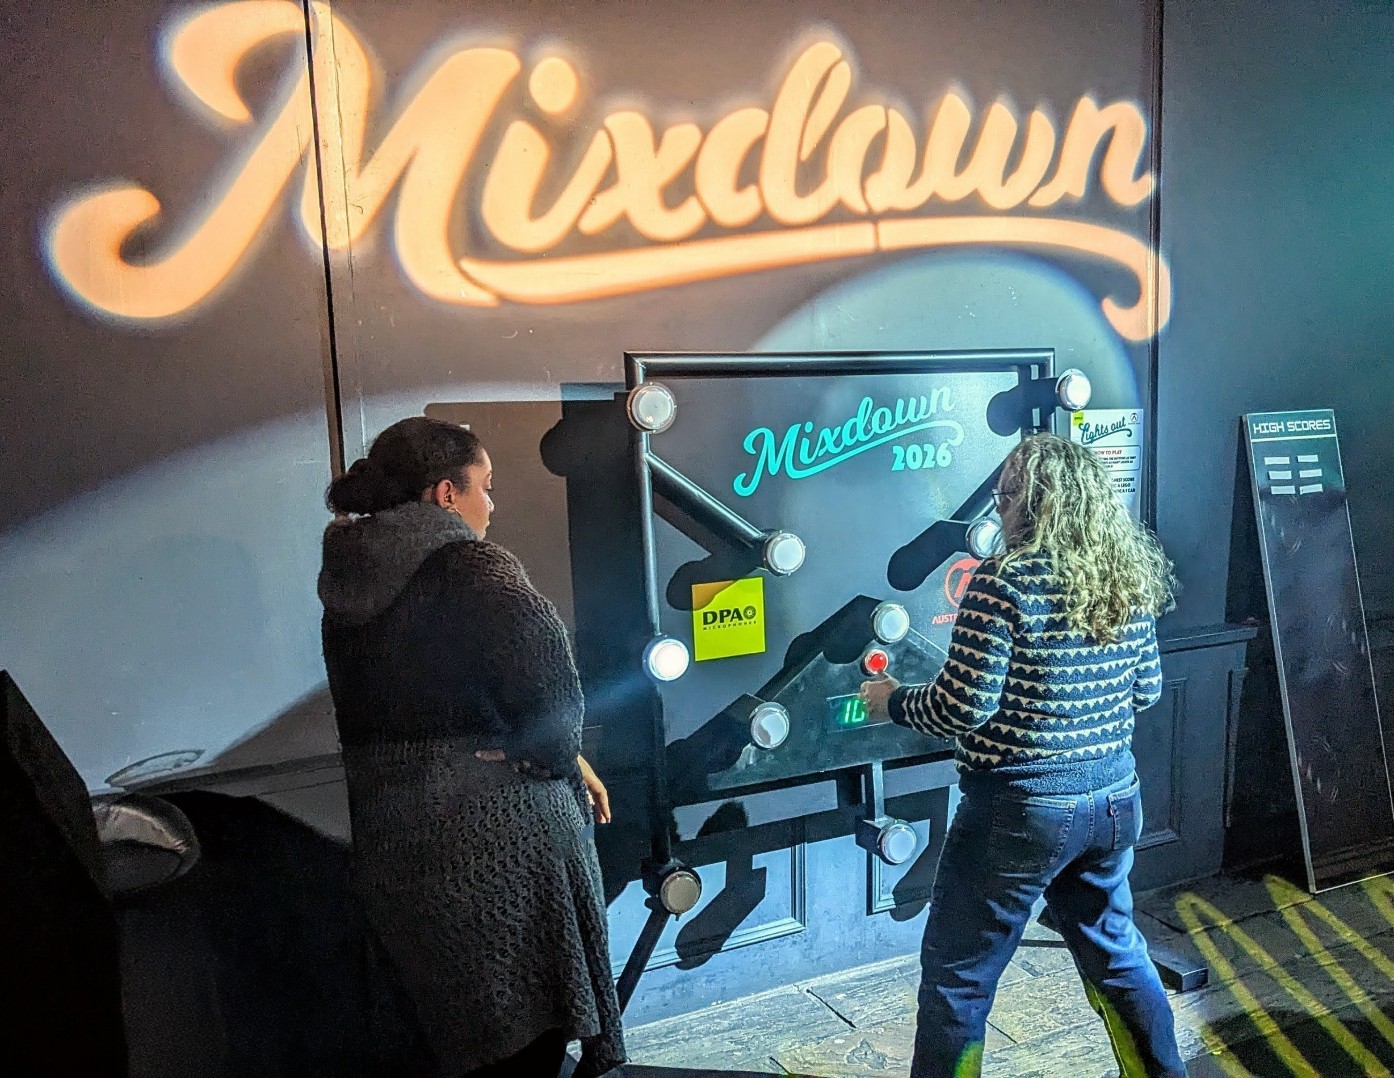
Branded interactive experiences — driving simulators, augmented reality games, reaction walls — typically improve dwell time and scan conversion because they give people a reason to stay and something to talk about. We have built custom trade show activations for brands including DHL, General Electric and Nando’s. As Diane Collins of Howdens put it after their driving simulator activation: “The driving simulator was amazing and enjoyed by all our customers and staff.” The commercial value still depends on what happens after the conversation — but dwell time creates the opportunity.
Worked example (illustrative) and ROI template
The figures below are hypothetical. They are here to show how the template works, not to set expectations for a specific show or industry.
Scenario: A company exhibits at a mid-size UK trade show, two days, 6 × 3 m stand.
| Cost line | Amount |
|---|---|
| Stand space | £4,200 |
| Stand design and build | £6,500 |
| Stand activation (your quote) | £3,000 |
| Staff (5 people × 2 days) | £3,000 |
| Travel and accommodation | £1,800 |
| Pre-show marketing | £1,200 |
| Post-show follow-up (2 reps × 1.5 days) | £900 |
| Total cost | £20,600 |
Results at 12 months:
- Leads captured: 68 (32 grade A, 24 grade B, 12 grade C)
- Revenue closed from show-sourced leads: £37,000
- Open pipeline still in progress: £14,000
Actual ROI = (£37,000 – £20,600) ÷ £20,600 × 100 = 79.6%
Projected ROI including pipeline at a 40% close rate: ((£37,000 + £5,600 − £20,600) ÷ £20,600) × 100 = 107%
Copy this template and replace the numbers with your own. Adjust the cost lines to match your actual spend. The structure — especially the 12-month revenue review — matters more than any individual figure.
What is a good trade show ROI?
There is no universal benchmark. Trade show ROI varies widely by industry, average deal size, sales cycle length, stand quality and how quickly leads are followed up.
A more useful question is how a show compares with your other lead-generation channels. If trade shows consistently deliver a lower cost per qualified lead than paid search or outbound, they are worth continuing. If they do not, the question is whether the non-revenue outcomes — brand presence, relationships, market intelligence — close the gap.
Track your own shows over two or three cycles. Your prior year is the most relevant benchmark you have.
Common mistakes
- Measuring too early. Checking ROI one month after the show misses the majority of the revenue in most B2B markets. Set the 12-month checkpoint before you go.
- Conflating footfall with leads. “800 people visited our stand” is not a lead metric; it is a reach metric.
- Missing the true cost. Staff time, follow-up effort and pre-show marketing all belong in the denominator.
- No CRM source tag. Without it, the revenue never makes it back to the show in your 12-month pull.
- No follow-up process agreed before the show. Leads without an assigned owner and a clear cadence decay quickly. Sort ownership before you travel, not in the car on the way home.
- Moving the goalposts after the fact. If goals shift to match results, the measurement is meaningless for next year’s planning.
FAQs
How do you measure event ROI?
Use ROI % = (net return ÷ total cost) × 100. Net return is revenue attributable to the event minus all costs. The challenge for most events is attribution — connecting a later sale back to the event conversation. CRM source tagging before the event is the most reliable method, reviewed at 3, 6 and 12 months.
How can ROI be measured?
Agree goals and define success before committing spend. Track all costs including staff time and follow-up. Capture leads with consent and tag them in your CRM. Measure closed revenue at 3, 6 and 12 months. For non-revenue outcomes like brand visibility or relationships, keep a separate qualitative record alongside the formula.
Is a 2% ROI good for a trade show?
Not in isolation. Compare it with your other marketing channels: what would the same budget have returned via paid search or outbound? Whether 2% is acceptable depends on your sector, sales cycle and the non-revenue value the show creates. A show with a low direct ROI may still be worth attending if it reaches an audience no other channel does.
How do you show trade show ROI visually?
A one-page summary works well: a cost vs pipeline bar chart, a lead funnel (footfall → conversations → scans → graded leads → pipeline → closed), and a table of non-revenue outcomes. Keep the board version to one page. The goal is to show the story — what went in, what came out, what is still in progress.
What is a good trade show ROI?
There is no universal benchmark. Compare your show ROI against your other marketing channels rather than a published figure. Focus on cost per qualified lead and cost per closed deal as the most actionable metrics, then track them across shows over time to see whether performance improves.
Tell us about your event and we’ll put together a tailored proposal.
Reverse links to add
/events/trade-shows— add a line pointing to this article, e.g. “How to measure your trade show ROI after the show”/experiences/augmented-reality— add a mention that AR activations can improve dwell time and lead conversion at trade shows, with a link to this article